Latest
issue
GET HCM
magazine
Sign up for the FREE digital edition of HCM magazine and also get the HCM ezine and breaking news email alerts.
Not right now, thanksclose this window I've already subscribed!
We Work Well Events
We Work Well Events
We Work Well Events
Follow Health Club Management on Twitter Like Health Club Management on Facebook Join the discussion with Health Club Management on LinkedIn
FITNESS, HEALTH, WELLNESS

features

Research: High expectations: Does hiring a starchitect help a developer build a taller building?

In a city like London where space is tight and planning rules are strict, are developers building taller by employing a famous architect? And after that investment, are they better off? Economists Paul Cheshire (LSE) and Gerard Dericks (University of Oxford) share their research

Published in CLADbook 2017 issue 1
Eric Parry Architects has designed a new London skyscraper, but it’s not easy to build tall in the capital / PHOTO: DBOX for Eric Parry Architects
Employing a Trophy Architect increased the overall sale price by 140 per cent

Buildings are rooted to the ground and architects tend naturally to work within their local systems of regulation: building regulations, environmental regulations or planning/land use regulation. Most are familiar with their own systems and think of those as the norm. In Britain, we assume our planning system is just the way planning systems are, but this is very far from true. The British system has many features not commonly found and these make it a real outlier in the world – especially together with the UK’s very centralised tax system, which gives almost no reward to local communities who accommodate development.

This article focuses on the effects of just one of the peculiarities of the UK planning system. Unlike most, it is not ‘rule-based’. In Continental Europe, the master planning system is all but universal. The community democratically adopts a plan which specifies what can be built on each parcel of land. The developer has a building designed that conforms to the rules applying to the plot and to local building and environmental regulations – and permission to build is all but automatic. Planning systems modelled on the US have zoning ordinances and building regulations and while it may be possible to obtain a zoning ordinance waiver, the default is that the developer builds what zoning and building regulations allow – and a permit is automatic.

RIGHT TO APPEAL
This is not the case in Britain. All changes to the use of any parcel of land which legally constitutes ‘development’ are subject to ‘development control’: that is, permission to develop is dependent on the decision of a committee of local politicians, advised by planning officials. In deciding whether to grant planning permission they’re not bound by the local plan – if they have one. Indeed, they often take little notice of its provisions. As it’s a quasi-legal process, if the would-be developer does not get permission from the local planning committee they can appeal: first to the Planning Inspectorate and, if that fails, to the Secretary of State – the politician in charge of the planning system. In the face of protests, local government representatives may refuse permission to avoid criticism from voters, but remain confident that the Inspectorate or the Secretary of State will ultimately grant permission.

It’s only worth the developer’s money to go to appeal for bigger developments so the UK’s decision-making process not only encourages opposition – every development is contestable – but it imposes considerable, if difficult to estimate, costs of both delay (the money is not earning while decisions are pending) and uncertainty. Since all decisions are contestable and politicised their outcome cannot be known in advance.

As the system keeps development scarce, there are considerable rents to be obtained if you can successfully ‘game’ the system to get permission. Recent research (Cheshire and Hilber, 2008) shows the scarcity of office space induced by the UK’s planning system imposed the equivalent of a tax of 810 per cent on the costs of building additional space in London’s West End.

GAMING THE SYSTEM
We recently (Cheshire and Dericks, 2014) set out to measure one particular way of gaming the system and estimate what success in that process added to the value of a site. We did this by estimating how much extra lettable space a developer could get by employing a ‘Trophy Architect’ (TA).

We obviously had to have a definition of what a TA was and decided on anyone who had been awarded one of the three major international prizes for lifetime achievement – the Pritzker, RIBA or AIA Gold Medals before the building was designed. We also needed to know what the typical extra construction costs of such buildings were. Gardiner & Theobald kindly supplied us with estimates of building costs per floor for buildings designed by ‘normal’ or Trophy Architects so we could estimate the net profit associated with getting additional space in a building by gaming the planning system by design.

Since development is a competitive process, however, it’s reasonable to assume there aren’t many £50 notes lying around on the streets of London waiting to be picked up. This implies that since any developer could in principle use a TA to get extra lettable space (assuming the data showed it happened) the extra net revenue is also a reasonable estimate of the costs involved. This is because the normal process of competition should mean that a developer cannot expect consistently to make more money by employing a TA to get extra space or else they would all do it. And they do not.

ADDED VALUE?
The bottom line is that we could estimate this effect and it was very large indeed. On average a TA could get an extra 18.77 floors on a site where heights were not absolutely constrained. While construction costs were greater, on a representative site in the City of London, employing a TA increased the overall sale price by 140 per cent (from £82m to £197m). Allowing for the additional construction costs typically incurred, the extra ‘value’ achievable on an average site in the City of London was still a hefty £73m.

However, as we argued above, since only some developers used TAs, the implication was that this £73m of apparent ‘profit’ was really just a measure of all those hidden costs: the extra time and the greater uncertainty of getting permission at all. This uncertainty reflects two separate sources of cost: 1) the attempted development may fail, so all funds employed are lost; 2) more uncertainty will be translated into greater risk so no project will go ahead unless there is a ‘risk premium’ – that is, expected returns are even bigger to cover the risks.

We estimated these effects by putting together a very rich data set on office buildings in London sold between 1999 and 2011. We not only had a very full range of characteristics of the buildings, including their architects and the awards their architects had won, and their exact locations – see Figure 1 – but a rich set of characteristics for the area surrounding their location: for example accessibility, the local concentration of jobs in the office sector, proximity of parks, gardens or water, proportion of surrounding area which was Conservation Area, the density of Listed Buildings and the planning restrictiveness of the Boroughs in which they were located (measured as refusal rates from 1990 to 2008 for applications to build offices).

One thing that was immediately apparent was over how much of at least Central London it is impossible to build tall buildings at all. For example, this is not possible in a Conservation Area (75 per cent of the City of Westminster is Conservation Area) or if the site is occupied by a Listed building. But there are also the sight lines of St Pauls, the Monument and the area around the Tower of London which are protected. Since writing the paper we have discovered the whole Borough of Islington – which borders the City – prohibited building anything above seven stories until 2007. Even now they only allow buildings taller than seven stories in a very small area close to the boundary with the City. Figure 2 shows these ‘height restricted areas’ for Central London and it’s obvious why London’s skyscrapers seem to be so randomly distributed: they can only be built on sites which are not height restricted and these are few and far between.

Using data from Real Capital Analytics and Estates Gazette, we identified a total of 2,932 unique sales. After cleaning, we ended up with a sample of 515 distinct buildings which, allowing for those sold more than once, yielded a total of 625 sales. We then statistically estimated two types of model. The first identify the ‘implicit prices’ of the characteristics of the buildings, including those of their neighbourhoods.

The second was to identify the role of each factor related to the total floorspace of each building. Full details are given in Cheshire and Dericks (2014) but we show a short version of the results in Table 1.

Because the London Council Act of 1890 imposed an absolute prohibition on building above 27 metres plus two-storeys in the roof, which was reduced in 1894 to 24 metres and 6 metres to the rooftop, there were virtually no tall buildings at all until these provisions were repealed in 1956. Therefore, we divide buildings and their architects into two groups, ‘pre-Modern’ building before 1956 and ‘Modern’ – all those built from 1956 onwards. Moreover because of the absolute height restrictions that continue to exist in all that part of London covered by Conservation Areas or subject to sight line restrictions, we also divided our buildings into those built in ‘Height Restricted’ areas and those not subject to that control.

The results in Table 1 tell us that the price for a building per m2 was substantially higher in areas where there were strong concentrations of employment in office employing sectors and that this effect was quite localised. We experimented with cut-offs from 100 to 1,000 metres and found the best results where we only included employment density within 6oo metres of the building. One reasonable interpretation of this is that quite localised agglomeration economies are important determinants of a building’s productivity and so what occupiers will pay for space within it.

There was no evidence that space in buildings designed by Modern TAs commanded any premium at all. On the other hand, buildings of Pre-Modern TAs and also Listed Buildings did command a premium per m2; and prices were higher where the Borough’s planning system made it more difficult to build, so the supply of office space was relatively more restricted.

BUILDING TALLER
On the other hand the results reported as model (2), in the right hand panel of the table, show that TAs certainly could build much taller buildings – but only where there was no absolute restriction on heights. On sites in these non-Height Restricted areas, employing a TA gave the developer an extra 18.77 floors on average. Even if we eliminate the three tallest buildings from the sample, this effect remains highly statistically significant though naturally somewhat reduced in terms of number of floors.

The results for this sample did not show any significant increase in the size of the floor plan for a site of given area (although we have now expanded the sample size to 835 buildings and find a small but significant increase in the average floor plan, too, while the increase in the number of floors remains almost the same). In other words employing a TA did not get the developer a premium per m2 of building but because it delivered so many more m2 of building on a given site, it generated far more value per unit area of site.

This extra value can be estimated for an average building – that is, we take the observed mean value of building and site characteristics for a representative non-Height Restricted site in the City of London (though in principle it could be anywhere in London). We then work out the total estimated value of the building if it is of the average height it was observed to be if built by a non-TA and again if it was built by a Modern TA. From these two estimates of total building revenue we subtract the estimated costs of building using the data supplied by Gardiner & Theobald for non-TA and TAs respectively. What this tells us is that employing a Modern TA for a typical non-Height Restricted site increased the value of that site by 140 per cent – a total of £73m. We can also work out what the ‘profit maximising’ height of a cheaper, non-TA office block would be if its height was not restricted by the planning system: about 90 floors! This assumes that other things stay the same – that is, only this particular building is not height restricted at all. If one could build to the profit maximising height everywhere then the supply of space would greatly increase and its price would come down and so – since the cost rises with a building’s height – buildings would end up being lower. We can make two final points. The first is illustrated in Table 2.

The cities with the most skyscrapers are New York followed by Hong Kong. Neither are shown above in the table because this is designed just to highlight the extremes related to the influence of planning restrictions – or lack of them.

Chicago has its share of TA buildings, but it is a lightly regulated land market and these amount to only 3 per cent of its total of 302 skyscrapers. Brussels – a smaller city but also lightly regulated – has fewer skyscrapers and none of them designed by a TA. The same in Benidorm, Spain – a good bit of trivia for the pub quiz; this is the city with the highest incidence of skyscrapers per resident of any in the world. The great majority would have been built when the city was hardly regulated at all and hotels and apartments were designed to provide at least a glimpse of the sea: lightly regulated, few residents as opposed to visitors and not a single TA designed building.

London wins one prize. It has very few skyscrapers for such a big and prosperous city, but we have already explored the reason for that; regulation makes it difficult to build anything taller than seven floors over most of London. The prize it wins is for the percentage of its skyscrapers designed by TAs, nearly 30 per cent, reinforcing the conclusion that employing a TA is a way of gaming the British planning system to persuade politicians to allow the developer to get more space on a given site. As the Secretary of State said when overturning the refusal of permission for London’s tallest building, the Shard: “For a building of this size to be acceptable, the quality of its design is critical … the proposed tower is of highest architectural quality”. And, he knew its design was exceptional because the architect was Renzo Piano.

DEADWEIGHT LOSS
The final point is that gaming the system in this way seems to be a pure deadweight loss in terms of welfare. Looked at through an economist’s lens the £73m extra revenue obtained using a TA on a typical city site is, in fact, a cost. It is a cost because it represents what needs to be spent to successfully game the system and that, as Ann Krueger showed a long time ago (Krueger, 1974), is in welfare terms a deadweight loss. If it was offset by any measurable gain then the cost would be less than £73m but as our work shows commercial clients are not willing to pay any premium for space in such buildings – so no offsetting value there. It remains possible that tourists, occupants of other offices with views to TA buildings or, indeed, Londoners get some value from TA buildings but as yet there is no evidence that they do. This is something on which we are working now so watch this space.

References:
Cheshire, P. and G. Dericks, ‘Iconic Design’ as Deadweight Loss: Rent acquisition by design in the constrained London office market, 2014, SERC Discussion Papers, No154, LSE.

http://www.spatialeconomics.ac.uk/textonly/SERC/publications/download/sercdp0154.pdf

Cheshire, P., and C. Hilber (2008) Office Space Supply Restrictions in Britain: The Political Economy of Market Revenge. Economic Journal, 118(529): F185-F221.

Krueger, A. (1974) The Political Economy of the Rent-Seeking Society. American Economic Review, 64(3): 291-303.

Table 1:

Explaining the Price and Height of Office Buildings in London
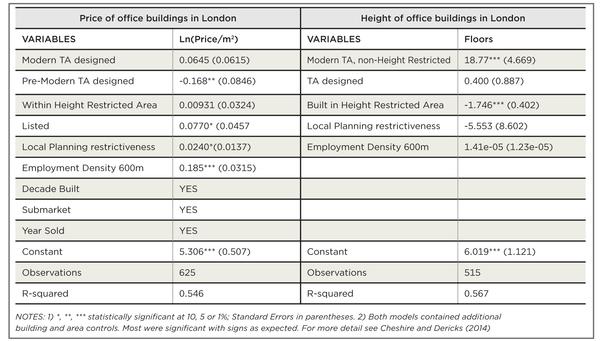
Table 1
Table 1

LONDON’S NEWEST SKYSCRAPER

Plans to build the tallest skyscraper in the City of London have been unveiled by Eric Parry Architects, who say it will feature the UK’s highest free public viewing gallery and put the public interests first.

At a height of 309.6 metres, Parry’s commercial tower, named 1 Undershaft, will be as tall as its Renzo Piano-designed neighbour The Shard – currently the tallest building in western Europe. It will be located in the heart of the capital’s financial district, between Norman Foster’s Gherkin and the Cheesegrater tower by Rogers Stirk Harbour + Partners.

The design envisions large areas of public space at both the top and bottom of the skyscraper. A new public square will be created at the base, while the top floors – featuring a 200-capacity restaurant – will be open to the public seven days a week. A budget has not yet been released.

Eric Parry Architect’s plans for a new skyscraper in London are equal in height to The Shard / PHOTO: DBOX for Eric Parry Architects

Table 2:

Skyscrapers in selected cities
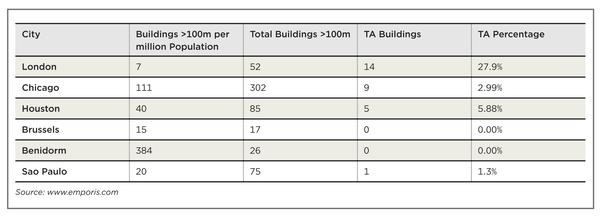
Table 2
Table 2

Fig 1

The Sample of Buildings Sold between 1999 and 2011
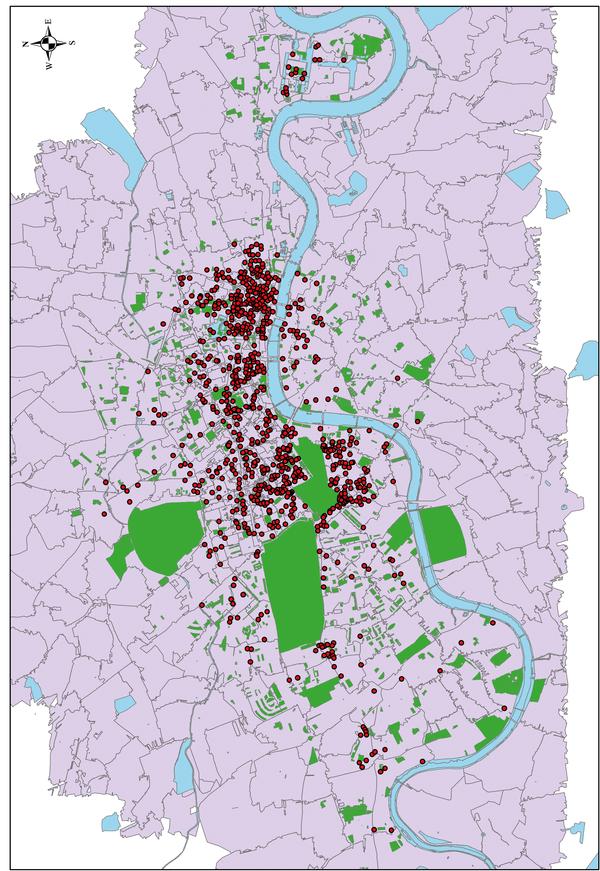
Fig 1
Fig 1

Fig 2

Height Restricted Areas I Central London (Does not include Borough of Islington)
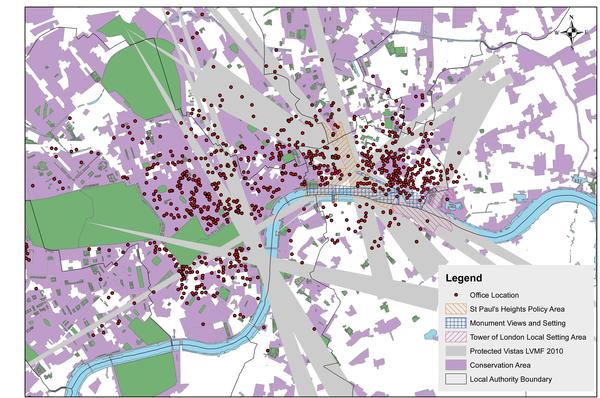
Fig 2
Fig 2
Sign up here to get HCM's weekly ezine and every issue of HCM magazine free on digital.
The Shard: Renzo Piano’s 95-floor skyscraper is the tallest in the EU / PHOTO: Michael Denance
Benidorm is the city with the most 100-metre-plus buildings per person (384 per million) / PHOTO: Shutterstock / Nika Che
New York is the city with the most 100-metre-plus buildings in the world (762)
https://www.leisureopportunities.co.uk/images/30224_725068.jpg
High expectations: Economists investigate whether a famous architect can help a developer build a taller building
Paul Cheshire, Economist (LSE) Gerard Dericks, Economist, (University of Oxford) ,Economists, famous architect, Central London, Skyscraper
HCM magazine
McFit, the original budget gym is undergoing a transformation with a new look and estate-wide overhaul, as Liz Terry reports
HCM magazine
As health club operators move to incorporate recovery into their offerings to meet growing consumer demand, Steph Eaves takes a look at what cryotherapy and ice bathing can add to the equation
HCM magazine
Industry suppliers are responding to the exponential increase in consumer demand for strength training with a raft of new and innovative launches and concepts, as Steph Eaves reports
HCM magazine
Will Orr has been talking to HCM about the company’s new strategy for 2024, as Kath Hudson reports
HCM magazine
We are the new youth club, a social space for young people to connect
HCM promotional features
Sponsored
Nuffield Health has 8,300 assets that are outside the original manufacturer’s warranty and are now being maintained by ServiceSport UK
HCM promotional features
Sponsored
University of Sheffield Sport has opened the doors of its flagship Goodwin Sports Centre following a major refurbishment
HCM promotional features
Sponsored
D2F had updated its brand styling to keep pace with business growth. MD, John Lofting and operations director, Matt Aynsley, explain the rationale
HCM promotional features
Sponsored
The partnership between PureGym and Belfast-based supplier BLK BOX is transforming the gym floor
HCM promotional features
Sponsored
Francesca Cooper-Boden says health assessment services can boost health club retention
HCM promotional features
Sponsored
GymNation is pioneering the future of fitness with software specialist Perfect Gym providing a scalable tech platform to power and sustain its growth
HCM promotional features
Sponsored
Epassi, a provider of workplace wellness benefits, is creating a fitter and more productive workforce, one membership at a time 
HCM promotional features
Sponsored
Operators, prepare to revolutionise the way members connect with personal trainers in your club, with the ground-breaking Brawn platform.
HCM promotional features
Sponsored
The New Keiser M3i Studio Bike brings ride data to life to engage and delight members
HCM promotional features
Latest News
Active Oxfordshire has received £1.3 million to tackle inactivity and inequality and launch a new ...
Latest News
Barry’s – known for its HIIT workouts combining treadmills and weights – is thought to ...
Latest News
Consultancy and change architects, Miova, have welcomed industry veteran Mark Tweedie on board. Tweedie had ...
Latest News
US private equity fund, Providence Equity Partners, is acquiring a majority stake in VivaGym from ...
Latest News
The Bannatyne Group says it has officially bounced back from the pandemic, with both turnover ...
Latest News
There is speculation that Basic Fit will sell the five Spanish Holmes Place clubs it ...
Latest News
While British adults are the most active they’ve been in a decade, health inequalities remain ...
Latest News
Kerzner International has signed deals to operate two new Siro recovery hotels in Mexico and ...
Featured supplier news
Featured supplier news: W3Fit EMEA’s innovative programme sets sail for Sardinia, Italy
Following a hugely successful event last year in Split, Croatia, W3Fit EMEA, is heading to the Chia Laguna resort in Sardinia from 8-11 October.
Featured supplier news
Featured supplier news: Webinar: Building a new energy future for the leisure sector
As one of the most energy-intensive industries in the UK, leisure facilities face a critical challenge in balancing net zero goals, funding and increased costs.
Company profiles
Company profile: IndigoFitness
At IndigoFitness, we're not just about providing equipment; we're about delivering exceptional training spaces. We ...
Company profiles
Company profile: CoverMe Ltd
CoverMe Fitness, an app for seamless, on-demand management and cover solutions for sports and fitness ...
Supplier Showcase
Supplier showcase - Jon Williams
Catalogue Gallery
Click on a catalogue to view it online
Featured press releases
Greenwich Leisure Limited press release: Innovative new partnership will see national roll-out of VR Esports Platform across UK leisure centres
Active Reality, a leader in Virtual Reality Freeroam Esports Arenas and GLL, the UK’s largest operator of municipal leisure centres, have today (3rd May 24) announced an innovative new partnership that will see a national roll out of gaming technologies within leisure centres across the country.
Featured press releases
KeepMe press release: Keepme unveils Fitness Marketers' Cheat Sheet containing AI strategies for fitness professionals
Keepme has announced the release of its newest addition to its Best Practice Series: the "Fitness Marketers' Cheat Sheet."
Directory
Lockers
Crown Sports Lockers: Lockers
Flooring
Total Vibration Solutions / TVS Sports Surfaces: Flooring
Snowroom
TechnoAlpin SpA: Snowroom
Cryotherapy
Art of Cryo: Cryotherapy
Salt therapy products
Himalayan Source: Salt therapy products
Spa software
SpaBooker: Spa software
Property & Tenders
Loughton, IG10
Knight Frank
Property & Tenders
Grantham, Leicestershire
Belvoir Castle
Property & Tenders
Diary dates
10-12 May 2024
China Import & Export Fair Complex, Guangzhou, China
Diary dates
23-24 May 2024
Large Hall of the Chamber of Commerce (Erbprinzenpalais), Wiesbaden, Germany
Diary dates
30 May - 02 Jun 2024
Rimini Exhibition Center, Rimini, Italy
Diary dates
08-08 Jun 2024
Worldwide, Various,
Diary dates
11-13 Jun 2024
Raffles City Convention Centre, Singapore, Singapore
Diary dates
12-13 Jun 2024
ExCeL London, London, United Kingdom
Diary dates
03-05 Sep 2024
IMPACT Exhibition Center, Bangkok, Thailand
Diary dates
19-19 Sep 2024
The Salil Hotel Riverside - Bangkok, Bangkok 10120, Thailand
Diary dates
01-04 Oct 2024
REVĪVŌ Wellness Resort Nusa Dua Bali, Kabupaten Badung, Indonesia
Diary dates
22-25 Oct 2024
Messe Stuttgart, Germany
Diary dates
24-24 Oct 2024
QEII Conference Centre, London, United Kingdom
Diary dates
04-07 Nov 2024
In person, St Andrews, United Kingdom
Diary dates

features

Research: High expectations: Does hiring a starchitect help a developer build a taller building?

In a city like London where space is tight and planning rules are strict, are developers building taller by employing a famous architect? And after that investment, are they better off? Economists Paul Cheshire (LSE) and Gerard Dericks (University of Oxford) share their research

Published in CLADbook 2017 issue 1
Eric Parry Architects has designed a new London skyscraper, but it’s not easy to build tall in the capital / PHOTO: DBOX for Eric Parry Architects
Employing a Trophy Architect increased the overall sale price by 140 per cent

Buildings are rooted to the ground and architects tend naturally to work within their local systems of regulation: building regulations, environmental regulations or planning/land use regulation. Most are familiar with their own systems and think of those as the norm. In Britain, we assume our planning system is just the way planning systems are, but this is very far from true. The British system has many features not commonly found and these make it a real outlier in the world – especially together with the UK’s very centralised tax system, which gives almost no reward to local communities who accommodate development.

This article focuses on the effects of just one of the peculiarities of the UK planning system. Unlike most, it is not ‘rule-based’. In Continental Europe, the master planning system is all but universal. The community democratically adopts a plan which specifies what can be built on each parcel of land. The developer has a building designed that conforms to the rules applying to the plot and to local building and environmental regulations – and permission to build is all but automatic. Planning systems modelled on the US have zoning ordinances and building regulations and while it may be possible to obtain a zoning ordinance waiver, the default is that the developer builds what zoning and building regulations allow – and a permit is automatic.

RIGHT TO APPEAL
This is not the case in Britain. All changes to the use of any parcel of land which legally constitutes ‘development’ are subject to ‘development control’: that is, permission to develop is dependent on the decision of a committee of local politicians, advised by planning officials. In deciding whether to grant planning permission they’re not bound by the local plan – if they have one. Indeed, they often take little notice of its provisions. As it’s a quasi-legal process, if the would-be developer does not get permission from the local planning committee they can appeal: first to the Planning Inspectorate and, if that fails, to the Secretary of State – the politician in charge of the planning system. In the face of protests, local government representatives may refuse permission to avoid criticism from voters, but remain confident that the Inspectorate or the Secretary of State will ultimately grant permission.

It’s only worth the developer’s money to go to appeal for bigger developments so the UK’s decision-making process not only encourages opposition – every development is contestable – but it imposes considerable, if difficult to estimate, costs of both delay (the money is not earning while decisions are pending) and uncertainty. Since all decisions are contestable and politicised their outcome cannot be known in advance.

As the system keeps development scarce, there are considerable rents to be obtained if you can successfully ‘game’ the system to get permission. Recent research (Cheshire and Hilber, 2008) shows the scarcity of office space induced by the UK’s planning system imposed the equivalent of a tax of 810 per cent on the costs of building additional space in London’s West End.

GAMING THE SYSTEM
We recently (Cheshire and Dericks, 2014) set out to measure one particular way of gaming the system and estimate what success in that process added to the value of a site. We did this by estimating how much extra lettable space a developer could get by employing a ‘Trophy Architect’ (TA).

We obviously had to have a definition of what a TA was and decided on anyone who had been awarded one of the three major international prizes for lifetime achievement – the Pritzker, RIBA or AIA Gold Medals before the building was designed. We also needed to know what the typical extra construction costs of such buildings were. Gardiner & Theobald kindly supplied us with estimates of building costs per floor for buildings designed by ‘normal’ or Trophy Architects so we could estimate the net profit associated with getting additional space in a building by gaming the planning system by design.

Since development is a competitive process, however, it’s reasonable to assume there aren’t many £50 notes lying around on the streets of London waiting to be picked up. This implies that since any developer could in principle use a TA to get extra lettable space (assuming the data showed it happened) the extra net revenue is also a reasonable estimate of the costs involved. This is because the normal process of competition should mean that a developer cannot expect consistently to make more money by employing a TA to get extra space or else they would all do it. And they do not.

ADDED VALUE?
The bottom line is that we could estimate this effect and it was very large indeed. On average a TA could get an extra 18.77 floors on a site where heights were not absolutely constrained. While construction costs were greater, on a representative site in the City of London, employing a TA increased the overall sale price by 140 per cent (from £82m to £197m). Allowing for the additional construction costs typically incurred, the extra ‘value’ achievable on an average site in the City of London was still a hefty £73m.

However, as we argued above, since only some developers used TAs, the implication was that this £73m of apparent ‘profit’ was really just a measure of all those hidden costs: the extra time and the greater uncertainty of getting permission at all. This uncertainty reflects two separate sources of cost: 1) the attempted development may fail, so all funds employed are lost; 2) more uncertainty will be translated into greater risk so no project will go ahead unless there is a ‘risk premium’ – that is, expected returns are even bigger to cover the risks.

We estimated these effects by putting together a very rich data set on office buildings in London sold between 1999 and 2011. We not only had a very full range of characteristics of the buildings, including their architects and the awards their architects had won, and their exact locations – see Figure 1 – but a rich set of characteristics for the area surrounding their location: for example accessibility, the local concentration of jobs in the office sector, proximity of parks, gardens or water, proportion of surrounding area which was Conservation Area, the density of Listed Buildings and the planning restrictiveness of the Boroughs in which they were located (measured as refusal rates from 1990 to 2008 for applications to build offices).

One thing that was immediately apparent was over how much of at least Central London it is impossible to build tall buildings at all. For example, this is not possible in a Conservation Area (75 per cent of the City of Westminster is Conservation Area) or if the site is occupied by a Listed building. But there are also the sight lines of St Pauls, the Monument and the area around the Tower of London which are protected. Since writing the paper we have discovered the whole Borough of Islington – which borders the City – prohibited building anything above seven stories until 2007. Even now they only allow buildings taller than seven stories in a very small area close to the boundary with the City. Figure 2 shows these ‘height restricted areas’ for Central London and it’s obvious why London’s skyscrapers seem to be so randomly distributed: they can only be built on sites which are not height restricted and these are few and far between.

Using data from Real Capital Analytics and Estates Gazette, we identified a total of 2,932 unique sales. After cleaning, we ended up with a sample of 515 distinct buildings which, allowing for those sold more than once, yielded a total of 625 sales. We then statistically estimated two types of model. The first identify the ‘implicit prices’ of the characteristics of the buildings, including those of their neighbourhoods.

The second was to identify the role of each factor related to the total floorspace of each building. Full details are given in Cheshire and Dericks (2014) but we show a short version of the results in Table 1.

Because the London Council Act of 1890 imposed an absolute prohibition on building above 27 metres plus two-storeys in the roof, which was reduced in 1894 to 24 metres and 6 metres to the rooftop, there were virtually no tall buildings at all until these provisions were repealed in 1956. Therefore, we divide buildings and their architects into two groups, ‘pre-Modern’ building before 1956 and ‘Modern’ – all those built from 1956 onwards. Moreover because of the absolute height restrictions that continue to exist in all that part of London covered by Conservation Areas or subject to sight line restrictions, we also divided our buildings into those built in ‘Height Restricted’ areas and those not subject to that control.

The results in Table 1 tell us that the price for a building per m2 was substantially higher in areas where there were strong concentrations of employment in office employing sectors and that this effect was quite localised. We experimented with cut-offs from 100 to 1,000 metres and found the best results where we only included employment density within 6oo metres of the building. One reasonable interpretation of this is that quite localised agglomeration economies are important determinants of a building’s productivity and so what occupiers will pay for space within it.

There was no evidence that space in buildings designed by Modern TAs commanded any premium at all. On the other hand, buildings of Pre-Modern TAs and also Listed Buildings did command a premium per m2; and prices were higher where the Borough’s planning system made it more difficult to build, so the supply of office space was relatively more restricted.

BUILDING TALLER
On the other hand the results reported as model (2), in the right hand panel of the table, show that TAs certainly could build much taller buildings – but only where there was no absolute restriction on heights. On sites in these non-Height Restricted areas, employing a TA gave the developer an extra 18.77 floors on average. Even if we eliminate the three tallest buildings from the sample, this effect remains highly statistically significant though naturally somewhat reduced in terms of number of floors.

The results for this sample did not show any significant increase in the size of the floor plan for a site of given area (although we have now expanded the sample size to 835 buildings and find a small but significant increase in the average floor plan, too, while the increase in the number of floors remains almost the same). In other words employing a TA did not get the developer a premium per m2 of building but because it delivered so many more m2 of building on a given site, it generated far more value per unit area of site.

This extra value can be estimated for an average building – that is, we take the observed mean value of building and site characteristics for a representative non-Height Restricted site in the City of London (though in principle it could be anywhere in London). We then work out the total estimated value of the building if it is of the average height it was observed to be if built by a non-TA and again if it was built by a Modern TA. From these two estimates of total building revenue we subtract the estimated costs of building using the data supplied by Gardiner & Theobald for non-TA and TAs respectively. What this tells us is that employing a Modern TA for a typical non-Height Restricted site increased the value of that site by 140 per cent – a total of £73m. We can also work out what the ‘profit maximising’ height of a cheaper, non-TA office block would be if its height was not restricted by the planning system: about 90 floors! This assumes that other things stay the same – that is, only this particular building is not height restricted at all. If one could build to the profit maximising height everywhere then the supply of space would greatly increase and its price would come down and so – since the cost rises with a building’s height – buildings would end up being lower. We can make two final points. The first is illustrated in Table 2.

The cities with the most skyscrapers are New York followed by Hong Kong. Neither are shown above in the table because this is designed just to highlight the extremes related to the influence of planning restrictions – or lack of them.

Chicago has its share of TA buildings, but it is a lightly regulated land market and these amount to only 3 per cent of its total of 302 skyscrapers. Brussels – a smaller city but also lightly regulated – has fewer skyscrapers and none of them designed by a TA. The same in Benidorm, Spain – a good bit of trivia for the pub quiz; this is the city with the highest incidence of skyscrapers per resident of any in the world. The great majority would have been built when the city was hardly regulated at all and hotels and apartments were designed to provide at least a glimpse of the sea: lightly regulated, few residents as opposed to visitors and not a single TA designed building.

London wins one prize. It has very few skyscrapers for such a big and prosperous city, but we have already explored the reason for that; regulation makes it difficult to build anything taller than seven floors over most of London. The prize it wins is for the percentage of its skyscrapers designed by TAs, nearly 30 per cent, reinforcing the conclusion that employing a TA is a way of gaming the British planning system to persuade politicians to allow the developer to get more space on a given site. As the Secretary of State said when overturning the refusal of permission for London’s tallest building, the Shard: “For a building of this size to be acceptable, the quality of its design is critical … the proposed tower is of highest architectural quality”. And, he knew its design was exceptional because the architect was Renzo Piano.

DEADWEIGHT LOSS
The final point is that gaming the system in this way seems to be a pure deadweight loss in terms of welfare. Looked at through an economist’s lens the £73m extra revenue obtained using a TA on a typical city site is, in fact, a cost. It is a cost because it represents what needs to be spent to successfully game the system and that, as Ann Krueger showed a long time ago (Krueger, 1974), is in welfare terms a deadweight loss. If it was offset by any measurable gain then the cost would be less than £73m but as our work shows commercial clients are not willing to pay any premium for space in such buildings – so no offsetting value there. It remains possible that tourists, occupants of other offices with views to TA buildings or, indeed, Londoners get some value from TA buildings but as yet there is no evidence that they do. This is something on which we are working now so watch this space.

References:
Cheshire, P. and G. Dericks, ‘Iconic Design’ as Deadweight Loss: Rent acquisition by design in the constrained London office market, 2014, SERC Discussion Papers, No154, LSE.

http://www.spatialeconomics.ac.uk/textonly/SERC/publications/download/sercdp0154.pdf

Cheshire, P., and C. Hilber (2008) Office Space Supply Restrictions in Britain: The Political Economy of Market Revenge. Economic Journal, 118(529): F185-F221.

Krueger, A. (1974) The Political Economy of the Rent-Seeking Society. American Economic Review, 64(3): 291-303.

Table 1:

Explaining the Price and Height of Office Buildings in London

Table 1
Table 1

LONDON’S NEWEST SKYSCRAPER

Plans to build the tallest skyscraper in the City of London have been unveiled by Eric Parry Architects, who say it will feature the UK’s highest free public viewing gallery and put the public interests first.

At a height of 309.6 metres, Parry’s commercial tower, named 1 Undershaft, will be as tall as its Renzo Piano-designed neighbour The Shard – currently the tallest building in western Europe. It will be located in the heart of the capital’s financial district, between Norman Foster’s Gherkin and the Cheesegrater tower by Rogers Stirk Harbour + Partners.

The design envisions large areas of public space at both the top and bottom of the skyscraper. A new public square will be created at the base, while the top floors – featuring a 200-capacity restaurant – will be open to the public seven days a week. A budget has not yet been released.

Eric Parry Architect’s plans for a new skyscraper in London are equal in height to The Shard / PHOTO: DBOX for Eric Parry Architects

Table 2:

Skyscrapers in selected cities

Table 2
Table 2

Fig 1

The Sample of Buildings Sold between 1999 and 2011

Fig 1
Fig 1

Fig 2

Height Restricted Areas I Central London (Does not include Borough of Islington)

Fig 2
Fig 2
Sign up here to get HCM's weekly ezine and every issue of HCM magazine free on digital.
The Shard: Renzo Piano’s 95-floor skyscraper is the tallest in the EU / PHOTO: Michael Denance
Benidorm is the city with the most 100-metre-plus buildings per person (384 per million) / PHOTO: Shutterstock / Nika Che
New York is the city with the most 100-metre-plus buildings in the world (762)
https://www.leisureopportunities.co.uk/images/30224_725068.jpg
High expectations: Economists investigate whether a famous architect can help a developer build a taller building
Paul Cheshire, Economist (LSE) Gerard Dericks, Economist, (University of Oxford) ,Economists, famous architect, Central London, Skyscraper
Latest News
Active Oxfordshire has received £1.3 million to tackle inactivity and inequality and launch a new ...
Latest News
Barry’s – known for its HIIT workouts combining treadmills and weights – is thought to ...
Latest News
Consultancy and change architects, Miova, have welcomed industry veteran Mark Tweedie on board. Tweedie had ...
Latest News
US private equity fund, Providence Equity Partners, is acquiring a majority stake in VivaGym from ...
Latest News
The Bannatyne Group says it has officially bounced back from the pandemic, with both turnover ...
Latest News
There is speculation that Basic Fit will sell the five Spanish Holmes Place clubs it ...
Latest News
While British adults are the most active they’ve been in a decade, health inequalities remain ...
Latest News
Kerzner International has signed deals to operate two new Siro recovery hotels in Mexico and ...
Latest News
Nuffield Health’s fourth annual survey, the Healthier Nation Index, has found people moved slightly more ...
Latest News
Short-term incentives to exercise, such as using daily reminders, rewards or games, can lead to ...
Latest News
With the launch of its 49th John Reed, RSG Group is looking for more opportunities ...
Featured supplier news
Featured supplier news: W3Fit EMEA’s innovative programme sets sail for Sardinia, Italy
Following a hugely successful event last year in Split, Croatia, W3Fit EMEA, is heading to the Chia Laguna resort in Sardinia from 8-11 October.
Featured supplier news
Featured supplier news: Webinar: Building a new energy future for the leisure sector
As one of the most energy-intensive industries in the UK, leisure facilities face a critical challenge in balancing net zero goals, funding and increased costs.
Company profiles
Company profile: IndigoFitness
At IndigoFitness, we're not just about providing equipment; we're about delivering exceptional training spaces. We ...
Company profiles
Company profile: CoverMe Ltd
CoverMe Fitness, an app for seamless, on-demand management and cover solutions for sports and fitness ...
Supplier Showcase
Supplier showcase - Jon Williams
Catalogue Gallery
Click on a catalogue to view it online
Featured press releases
Greenwich Leisure Limited press release: Innovative new partnership will see national roll-out of VR Esports Platform across UK leisure centres
Active Reality, a leader in Virtual Reality Freeroam Esports Arenas and GLL, the UK’s largest operator of municipal leisure centres, have today (3rd May 24) announced an innovative new partnership that will see a national roll out of gaming technologies within leisure centres across the country.
Featured press releases
KeepMe press release: Keepme unveils Fitness Marketers' Cheat Sheet containing AI strategies for fitness professionals
Keepme has announced the release of its newest addition to its Best Practice Series: the "Fitness Marketers' Cheat Sheet."
Directory
Lockers
Crown Sports Lockers: Lockers
Flooring
Total Vibration Solutions / TVS Sports Surfaces: Flooring
Snowroom
TechnoAlpin SpA: Snowroom
Cryotherapy
Art of Cryo: Cryotherapy
Salt therapy products
Himalayan Source: Salt therapy products
Spa software
SpaBooker: Spa software
Property & Tenders
Loughton, IG10
Knight Frank
Property & Tenders
Grantham, Leicestershire
Belvoir Castle
Property & Tenders
Diary dates
10-12 May 2024
China Import & Export Fair Complex, Guangzhou, China
Diary dates
23-24 May 2024
Large Hall of the Chamber of Commerce (Erbprinzenpalais), Wiesbaden, Germany
Diary dates
30 May - 02 Jun 2024
Rimini Exhibition Center, Rimini, Italy
Diary dates
08-08 Jun 2024
Worldwide, Various,
Diary dates
11-13 Jun 2024
Raffles City Convention Centre, Singapore, Singapore
Diary dates
12-13 Jun 2024
ExCeL London, London, United Kingdom
Diary dates
03-05 Sep 2024
IMPACT Exhibition Center, Bangkok, Thailand
Diary dates
19-19 Sep 2024
The Salil Hotel Riverside - Bangkok, Bangkok 10120, Thailand
Diary dates
01-04 Oct 2024
REVĪVŌ Wellness Resort Nusa Dua Bali, Kabupaten Badung, Indonesia
Diary dates
22-25 Oct 2024
Messe Stuttgart, Germany
Diary dates
24-24 Oct 2024
QEII Conference Centre, London, United Kingdom
Diary dates
04-07 Nov 2024
In person, St Andrews, United Kingdom
Diary dates
Search news, features & products:
Find a supplier:
We Work Well Events
We Work Well Events
Partner sites